Wall Street is on a roll, with major Stock Market indexes soaring to new highs in 2024. The Dow Jones Industrial Average has climbed 17%, the S&P 500 has surged 26%, and the tech-heavy Nasdaq Composite has gained 28% as of November 13. Driving this rally is excitement about artificial intelligence (AI), stock splits, and optimism around President-Elect Donald Trump’s second term.
But history has shown that when the market heats up this much, trouble often follows.
The Shiller P/E Ratio: A Warning Signal in a Bull Market
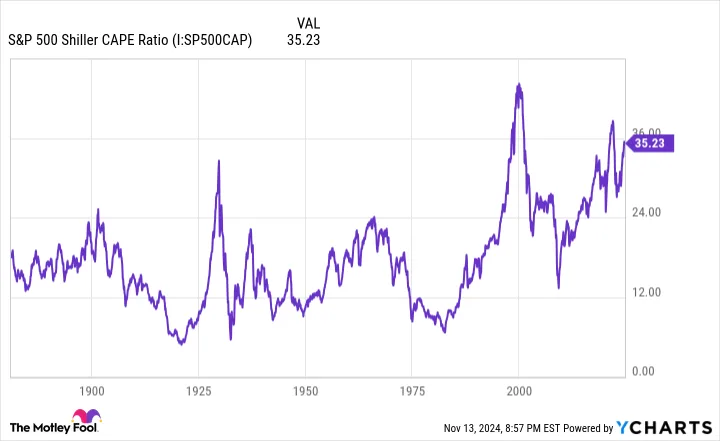
Among the many tools investors use to evaluate the stock market, the Shiller P/E ratio, or cyclically adjusted price-to-earnings (CAPE) ratio, stands out. This metric smooths earnings data over a decade, adjusting for inflation, and provides a long-term view of market valuation.
As of November 13, the Shiller P/E ratio for the S&P 500 stood at 38.18, more than double the historical average of 17.17 since 1871. This has only happened three times before in 153 years, during the dot-com bubble (1999) and briefly in early 2022.
What followed those peaks? Massive Stock Market downturns. After 1999, the S&P 500 dropped 49% at its lowest, and the Nasdaq Composite fell even further. Similarly, the overvaluations of early 2022 preceded a bear market that affected all major indexes.
Read more: Warren Buffett Sells 3 Major Stocks—What’s Behind the Move?
Historical Patterns and Bear Market Warnings
Zooming out, the Shiller P/E has surpassed 30 only six times since 1871, including today. Each of the five prior instances led to significant market corrections or bear markets, with declines ranging from 20% to 89%.
While the Shiller P/E doesn’t predict when these corrections will happen, its flawless track record suggests they’re inevitable.
Perspective Is Key: Patience Pays in the Long Run
Stock market downturns are normal, but they’re often short-lived. Data from Bespoke Investment Group highlights that the average bear market for the S&P 500 since the Great Depression lasted just 286 days, or about 9.5 months. In contrast, bull markets have averaged 1,011 days, nearly three years.
Recessions follow a similar pattern. Post-World War II, nine out of 12 U.S. recessions ended within a year, and none exceeded 18 months.
For long-term investors, this highlights the importance of staying the course. The U.S. economy spends more time growing than shrinking, and patience can lead to significant gains over time.

A Once-in-a-Lifetime Opportunity?
If you’re feeling like you missed the boat on some of the most successful Stock Market, don’t panic. According to analysts, there’s still time to capitalize on new opportunities. Companies that look overvalued today might be tomorrow’s big winners.
Take historical examples:
- Amazon: A $1,000 investment in 2010 would now be worth $22,819.
- Apple: A $1,000 investment in 2008 would now be worth $42,611.
- Netflix: A $1,000 investment in 2004 would now be worth an astounding $444,355.
Right now, analysts are issuing “Double Down” alerts for three promising companies. This could be your chance to invest before the next big breakout.

Final Thoughts
History may be repeating itself, with sky-high valuations pointing to an eventual downturn. But for those with patience and perspective, the long-term rewards of investing in the stock market are clear. Bear markets might be scary, but they’re temporary. Bull markets and economic expansions last much longer, and the patient investor always comes out ahead.
Don’t let fear keep you from acting. Whether you’re holding steady or ready to “double down,” now is the time to plan for what’s next.


Leave a Reply